The goal of this project is to determine the optimal use of investments in the conservation of South American carnivores. We developed a GIS framework to guide the decision-making process toward the maximum conservation gains per monetary unit at the continental scale. Our method can be extrapolated to other taxonomic groups and scales of analysis.
Our GIS model determined the best spatial combination of conservation value and their threats (using human pressure as the surrogate of threats) with land acquisition costs. In the same vein, we compared conservation value with carbon storage in order to estimate conservation gains related to the carbon market, only considering investment in native forests.
A preliminary version of this model was recently developed by our research group in collaboration with the Brazilian Biodiversity Fund (FUNBIO), based on the JRC's APAAT methodology, to determine investment prioritization for conservation in the Andes-Amazon basin in South America (See results in Ecofunds Database). The maps included in this presentation synthesize the status of the whole carnivore group, in which the total conservation value is a pixel-to-pixel sum of the specific conservation value of sympatric species. Moreover, the model allows a more detailed analysis (i.e.: at a specific local level or per country, biome or ecoregion).
We chose carnivores for our assessment because they are- as top predators- surrogates of species richness. Then, if we prioritize conservation efforts on the basis of carnivore needs, other taxonomic groups should be benefiting by the so-called umbrella effect.
By the combination of layers from the ARC GIS geodatabase and following the criteria summarized in the flowchart, we created the following maps (which are the innovative products of our project):
Conservation value - This map depicts a ranking of conservation values based on different species of South American carnivores. The result is a gradient map displaying the density of occurrence of such species, ranging from red (maximum value) to green (minimum value).
Threats to conservation - This map is an arithmetic product between the conservation value of each site and the "Human Pressure" map. The maximum values (red and orange) express the convergence of maximum conservation value with maximum threat levels, and therefore the areas of highest priority for threat mitigation.
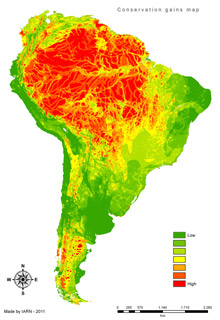
Conservation gains - This map reflects the relative gains in conservation value regarding initial investment costs for the establishment of new protected areas. Red and orange reflect the highest gains and green reflect the lowest. The first map focuses exclusively on land acquisition value, while the second incorporates carbon sequestration values.
What is innovative in this project?
The resulting maps provide the Conservation Return on Investment in biodiversity via top predator conservation in two ways: land acquisition to create protected areas (direct), investment in carbon dioxide storage in native forest (indirect). Our maps can guide the decision-making process, including government, NGO´s and private donors, by establishing in which places the investment is more efficient in terms of conservation value content.
Final map identifying conservation gains: